
Graphs and mini-sectors
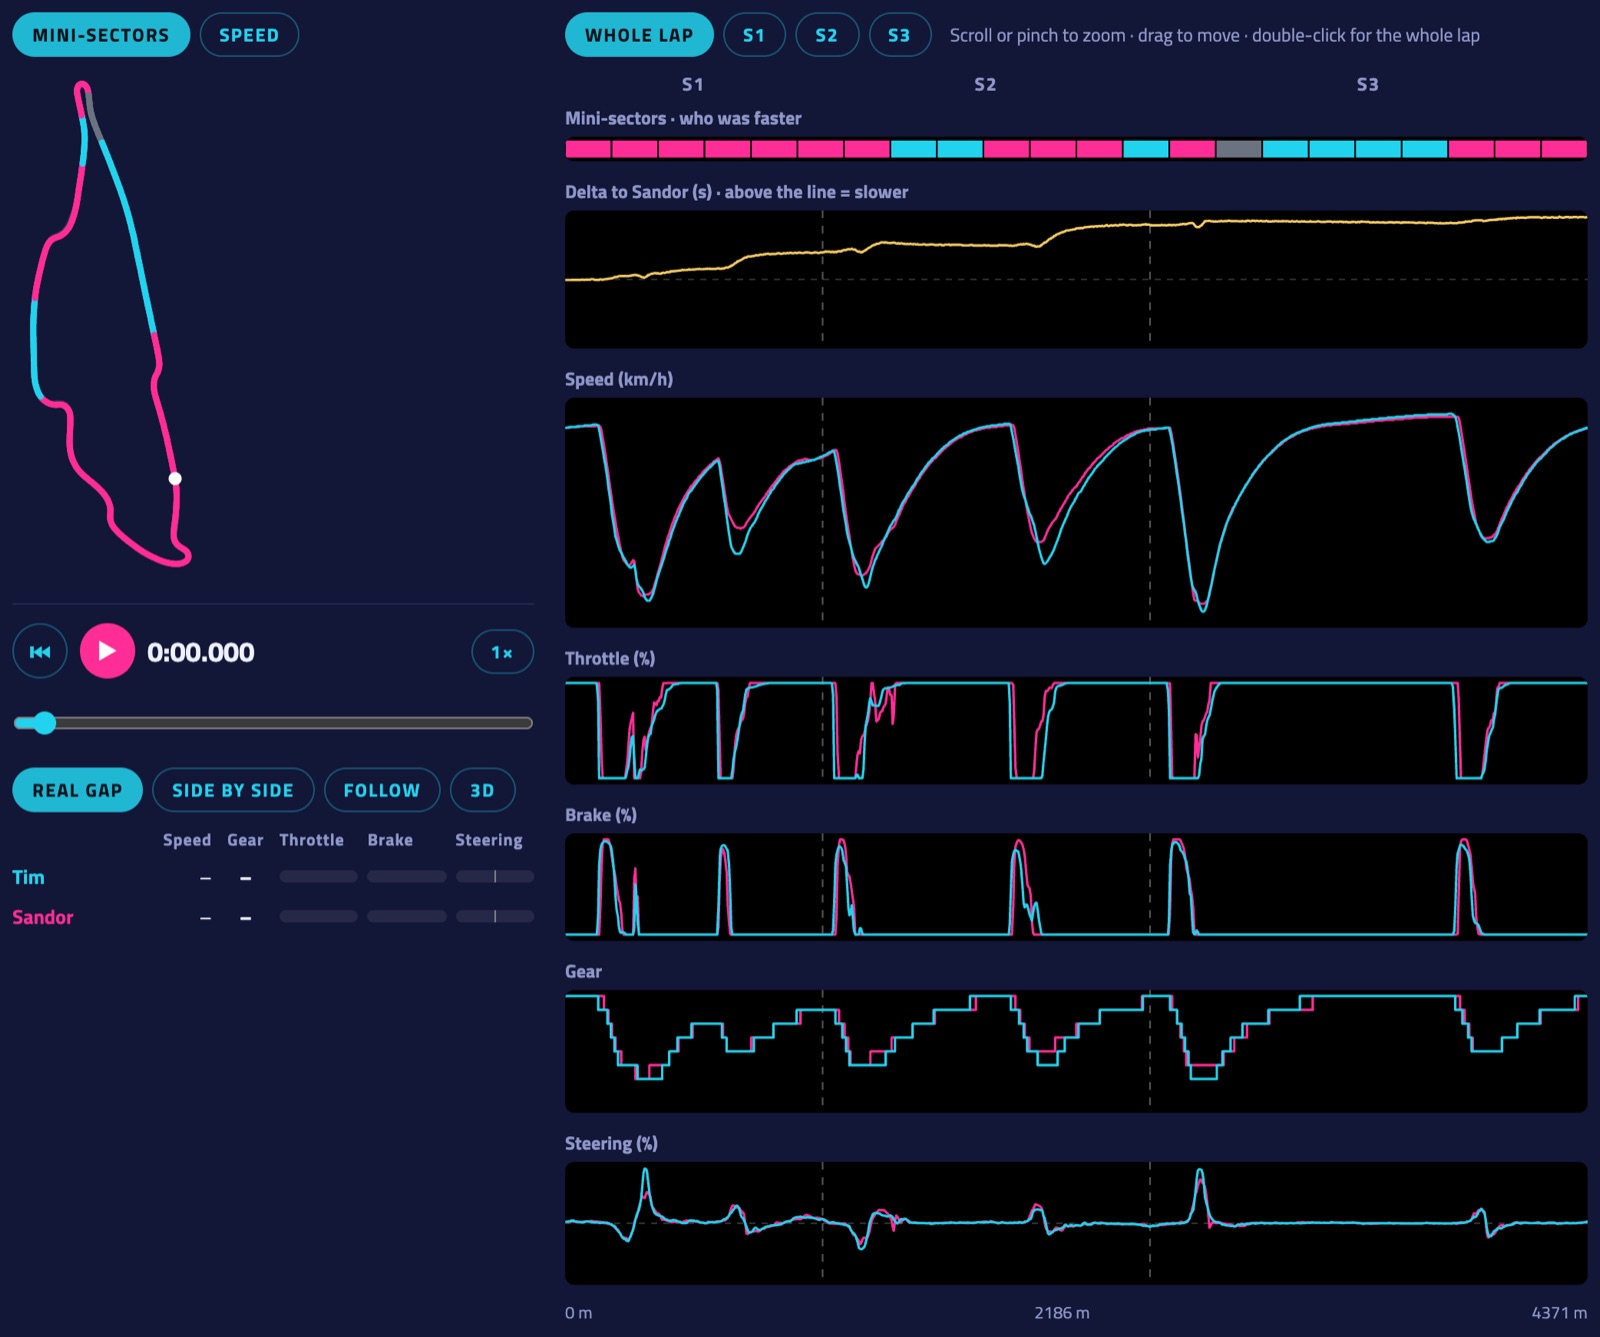
- Zoom: scroll (or pinch on a phone) over the graphs, drag to move, double-click for the whole lap. The S1, S2 and S3 buttons show one sector. The zoomed stretch lights up on the map.
- Pointing anywhere shows both drivers' values in a tooltip and both cars on the map.
- Delta: above the line means slower than the other lap at that point.
- More laps at once (Pro): next to "Compare with", Also show adds up to three more laps as dashed lines in every chart, with a table of their times and sectors; they also drive along in the replay (see Replay). Laps in the same conditions lists laps on this board driven on the same tyres, weather and TC/ABS with the track within 6 °C — a fair yardstick when the track was hot.
- Reactions: under a board lap's title, give it a 🏁 Respect, 🔥 On fire, 🤯 How?! or 😅 Wild one (signed in, not on your own laps). Everyone sees the counts, only the driver sees who.
- Share: the ↗ Share button next to the reactions gives a link to a board lap. Pasted in WhatsApp, Discord or anywhere else that shows previews, it becomes a card with the track, the driver, the time and the position.
- Remarks (signed in): pin a note to a spot on a lap — where to brake, a line to try, what went right. Point at the spot in the charts, write it in the Remarks card and choose who reads it: only you, the lap's driver, or your friends. Diamonds above the charts and on the map show where they are; the driver gets a notification.
- Racing line: how far your line is from the other lap's, metre by metre (above the middle = further left). Where one of you gains time the gap is shaded in that driver's colour, so you see which line paid off. Move over it: in a corner it says wider or tighter, on a straight left or right.
- Car angle: how sideways the car is — the angle between where the nose points and where the car really goes. Up means the nose points further into the corner (the rear is sliding), down means it points out (the front is washing wide). A clean lap stays within a few degrees; compare the peaks with the faster lap. The map's Car angle button colours your line the same way. F1 25 and iRacing (with GPS from telemetry files); Assetto Corsa and AC EVO don't send a usable heading.
- Mini-sectors cut the lap into pieces of about 200 m. When comparing they show who was faster where, in the two drivers' colours (grey: equal). On your own they compare with the fastest time on the board for each piece: purple where you're the fastest. The ideal lap is everyone's best mini-sectors added up.
- Click a mini-sector (on the strip or in the summary) to zoom in on it.
More in the guide: Getting started · Which laps count · iRacing · Switching drivers · The phone dash · The on-screen overlay · Leaderboards · Weekly challenges · Driver rankings · Driver rating · Achievements · The lap page · Setups of the fastest laps · My laps: every lap you drove · My progress: how you develop · Replay: 2D and 3D · The corner table · Telemetry Studio · Track maps · Your account and notifications · Profile, friends and groups · Rigs and friends · Fair play · Privacy and your data · Troubleshooting